


Much has been made of the “China Shock,” or the impact on US manufacturing from two related trade policy changes: the US granting China permanent normal trade relations in 2000, and China’s accession to the WTO in 2001. As Scott Lincicome has pointed out, the policy discussion has strayed from the academic research on this topic in several important ways: the job losses are frequently overstated, it didn’t devastate the US economy (it probably helped), and the prominent authors of papers on the China Shock don’t think the negative impacts justify broad-based tariffs.
Today I’ll deflate another piece of the China Shock political narrative: that it crushed American communities.
David Autor and co-authors have been some of the primary contributors to academic research on the China Shock, showing its negative impact on certain people living in various parts of the US and contextualizing those impacts. In a 2021 paper, those authors provide a list of the “most trade-impacted” commuting zones from the China Shock (the list is found in the Online Appendix Table A4). From this list, we can identify 10 metropolitan statistical areas (MSAs) that are the most affected by Chinese imports (MSAs and commuting zones are defined slightly differently, but there is a lot more data available for MSAs). The remainder of the trade-affected commuting zones they identify are much smaller, rural counties, with less available data, so I won’t dig into them in this post.
What happened to those “most affected” MSAs? Here’s a shocking fact: all of the MSAs hit hard by the China Shock still managed to have significant and positive real wage growth across the distribution since 2001, the earliest comparable data in the BLS OEWS data, conveniently timed at the beginning of the China Shock (note: for Cleveland, TN the data is first available in 2005, since it was not recognized as an MSA until 2003). Wage gains in several of these places, in fact, are better than the national trends.
The chart below shows the 10th percentile and median wages, adjusted for inflation, from the BLS Occupational Employment and Wage Statistics, and BLS also publishes wages at the 25th, 75th, and 90th percentiles (the 10th percentile wage is the point in the distribution where 10 percent of workers are below that wage, while the median is the middle of the distribution). Every single MSA in this group had positive real wage growth since 2001 in every single slice of the distribution that BLS reports. It is also notable that the 10th percentile workers saw larger gains than the median worker. I only show the 10th percentile wage and median wage in the chart for clarity of presentation, but all of the gains would be positive if I had used the 25th, 75th, or 90th percentiles.
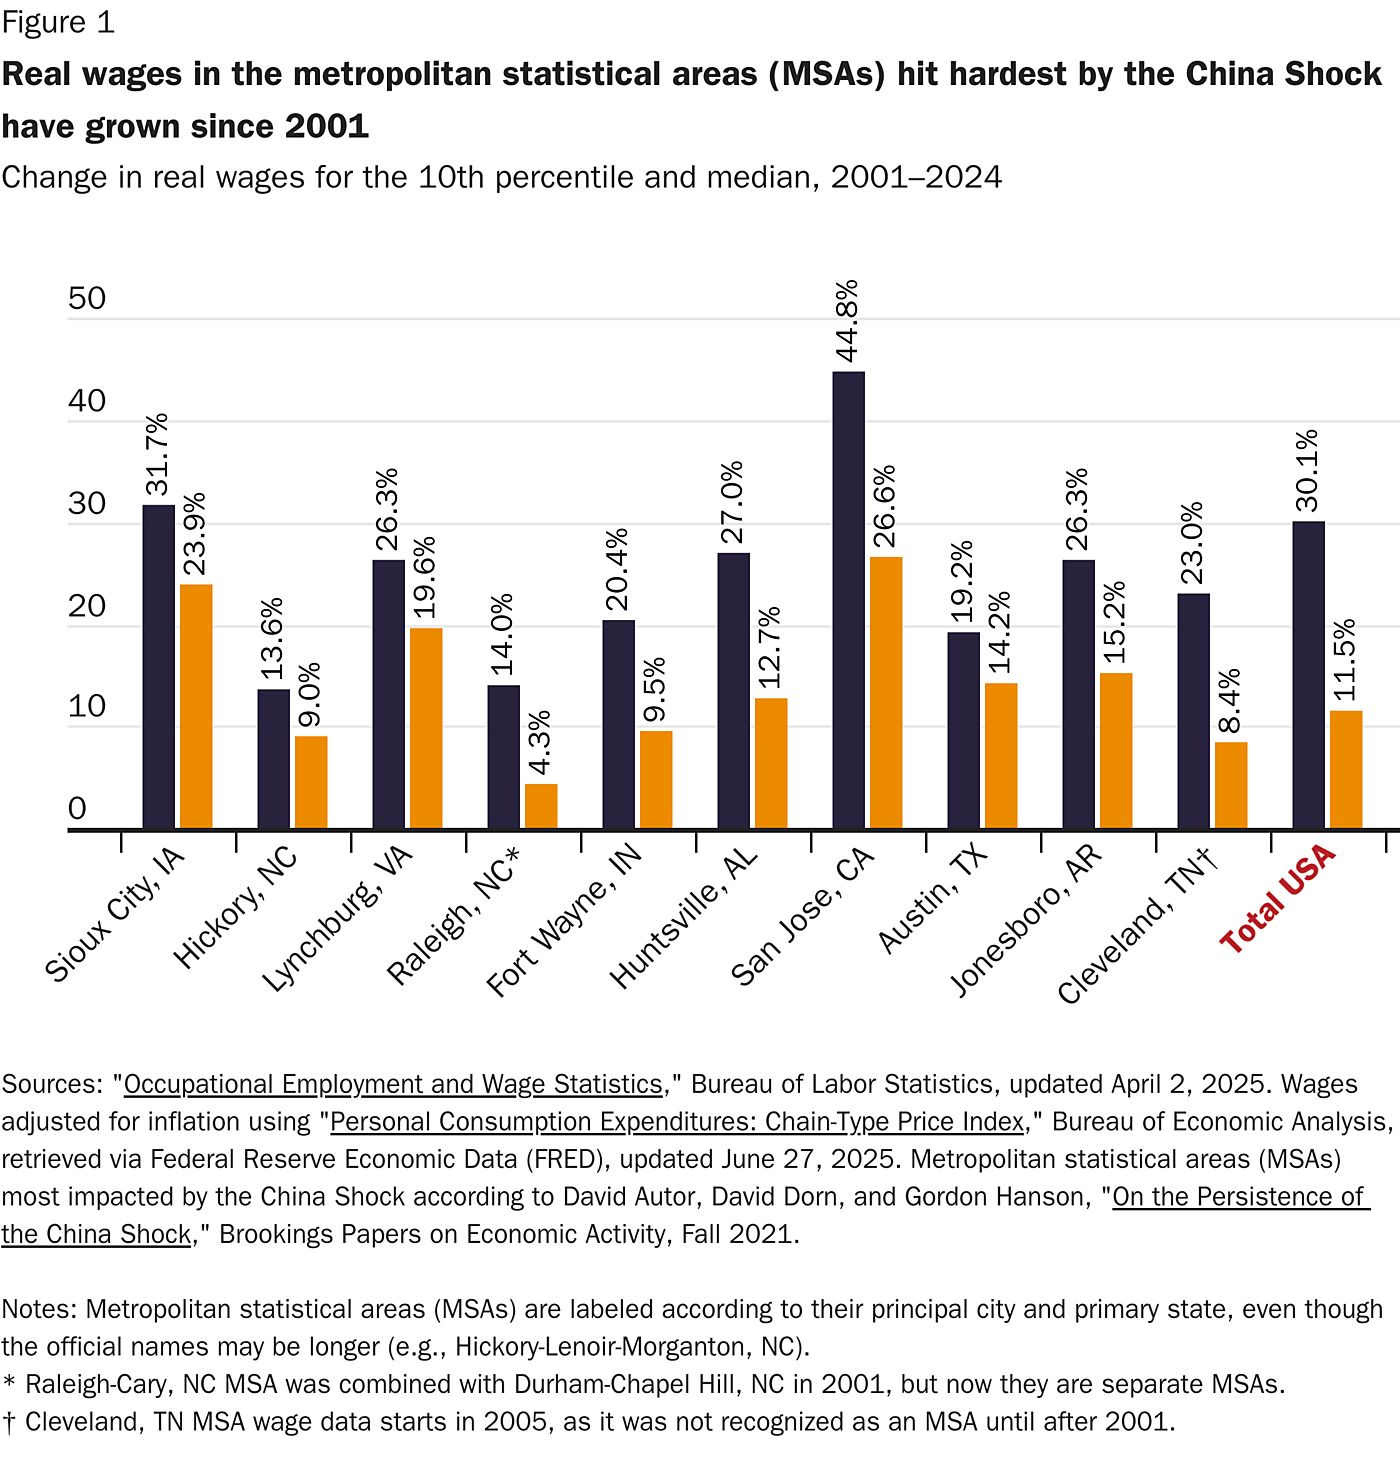
For comparison, the national median wage increased by 11.5 percent (adjusted for inflation) from 2001 to 2024, and the 10th percentile wage increased by 30.1 percent. This means that most of these MSAs experienced slower wages at the bottom end than did the nation as a whole. That may be the China Shock. But we shouldn’t confuse this outcome with the communities being worse off than they were decades ago.
Perhaps wages are rising because people are dropping out of the labor force, thus artificially boosting the wages we observe in the OEWS data. That could be the case if the workers losing their jobs have below-average wages. When we look only at manufacturing jobs, all ten of these MSAs saw manufacturing employment fall since 2000, even though some of them saw recovery after the Great Recession. However, as we will see below, gains in jobs in other sectors offset those manufacturing job losses in almost all of these cities.
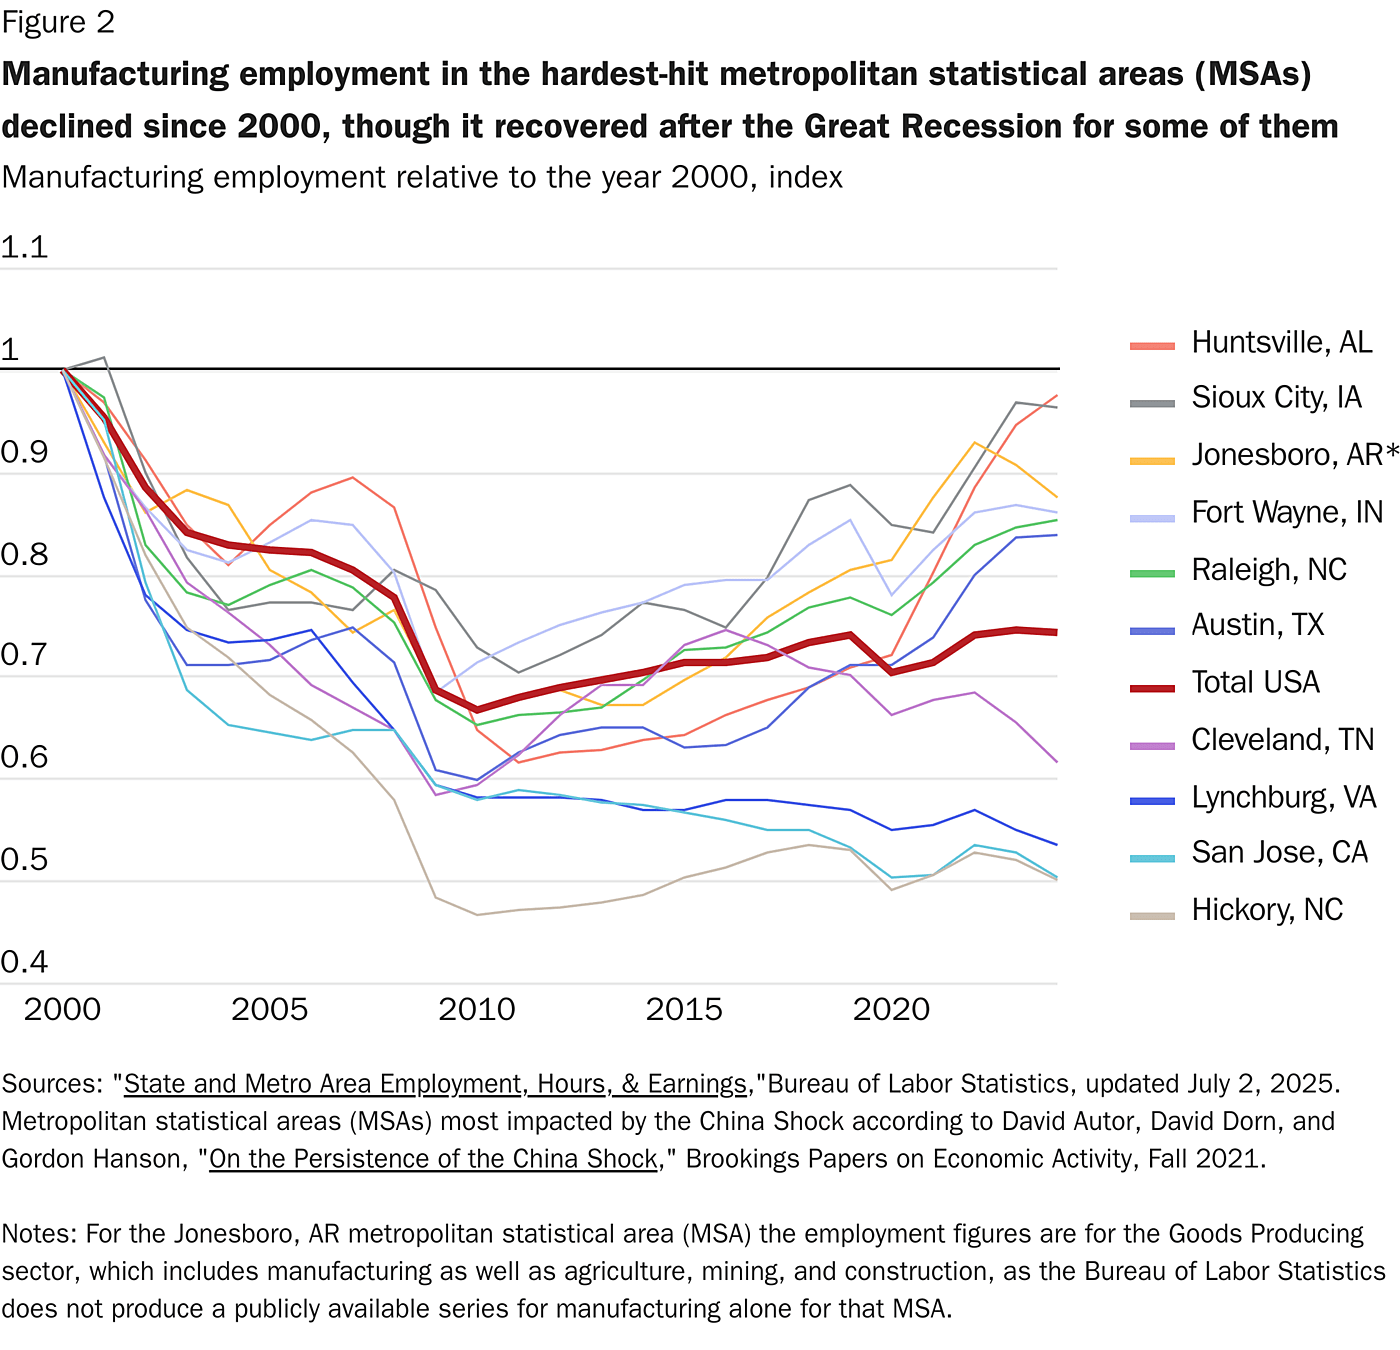
For comparison, total US manufacturing employment declined by 25.8 percent from 2000 to 2024. Thus, six of these ten trade-affected MSAs saw smaller declines in manufacturing employment than the nation as a whole, even though three of these MSAs (Lynchburg, San Jose, and Hickory) lost around half of the manufacturing jobs they had in 2000.
But we don’t only care about manufacturing jobs. Indeed, there isn’t necessarily a reason to prefer manufacturing jobs to other jobs. What we care about are whether people have jobs, whether those jobs pay well, and other characteristics about the jobs (how dangerous they are, how stable they are, etc.). Thus, it makes sense to look at total employment for these MSAs and not just bemoan the decline of one sector.
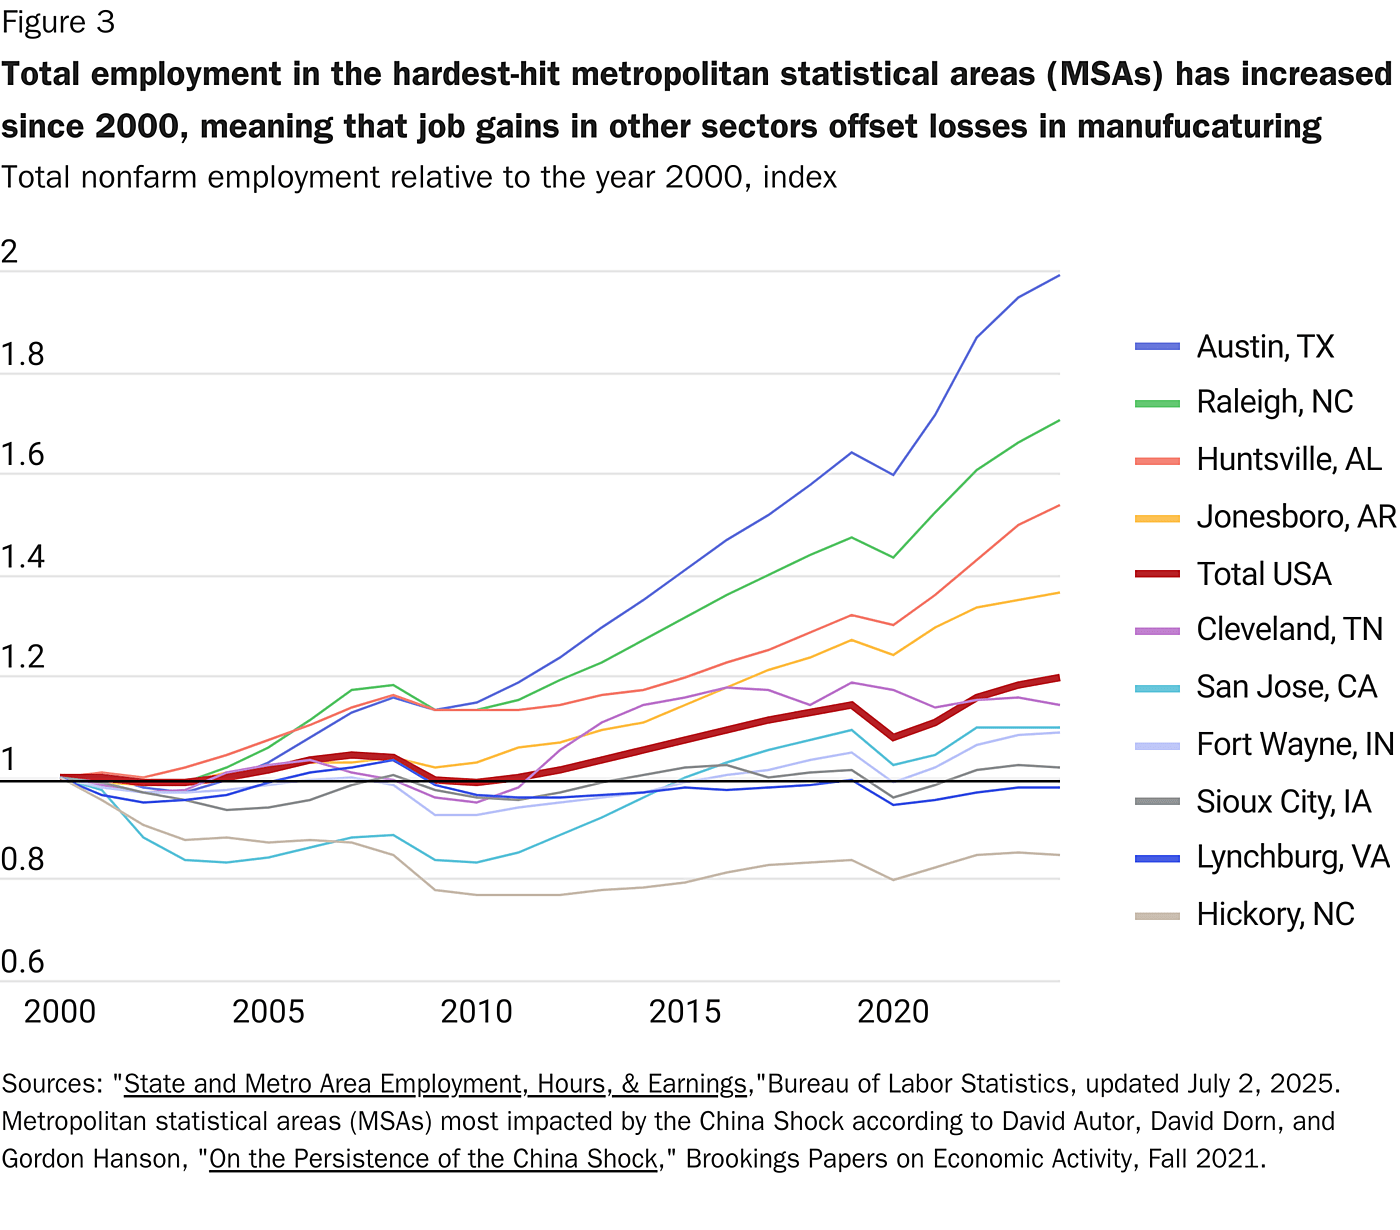
For comparison, total US growth in nonfarm jobs over the same period was 19.7 percent from 2000 to 2024. Thus, while the majority of these areas had total job growth below the national average, four of the MSAs had job growth that exceeded the national average. Only one MSA—Hickory, NC—clearly lost jobs since 2000, while Sioux City and Lynchburg had close to no net job growth. Thus, we can see that, at least on net, the rise in real wages for most of these hard-hit MSAs is not caused by a decline in labor force participation, though there may have been a change in exactly who the workers were and their education and training levels.
Even the one exception of Hickory, NC (full name: Hickory-Lenoir-Morgantown MSA), the worst performer in job growth in this group, has performed better than the pessimistic projections. For example, a 2011 report predicted that in Hickory, “unemployment levels won’t reach pre-recession levels for another decade,” when the unemployment rate in Hickory was 12 percent, and put the prospects for Hickory “near the bottom of the road for recovery nationwide.” But three years later, the unemployment rate was down to 6.2 percent, on par with 2006 and 2007. By 2018, it had dropped all the way to 3.7 percent, the lowest since the late 1990s, and slightly below the national rate of 3.9 percent. As my colleague (and North Carolina resident) Scott Lincicome has repeatedly noted, Hickory’s economy is doing well today, and the area has repeatedly been voted one of the best places to live in the country.
How did these areas perform so well, given the pessimistic narrative of the China Shock? Remember, again, to emphasize, these are the MSAs that are likely the worst hit by the Shock. We are already making the hard case, not cherry-picking MSAs with good stories of recovery.
For MSAs such as San Jose (which includes Silicon Valley), Austin, and Raleigh, their resilience from the China Shock is not surprising. As Autor et al. point out, diverse areas with a high concentration of college-educated workers in 2000 (these areas were all over 30 percent college educated, while the other “most impacted” areas were under 20 percent) and low concentration of manufacturing employment in 2000 (these areas were all under 21 percent, the lowest 3 on the “most impacted” list) were able to adapt well to the China Shock, even if they experienced significant manufacturing job losses. On the other hand, areas with the opposite combination—high manufacturing employment and low numbers of college-educated workers —faced bigger challenges in adjusting to the Shock.
Indeed, Autor and his co-authors contrast the performance of Raleigh-Cary and Hickory (separated into the commuting zones of North and West Hickory), both located in North Carolina and separated by less than 200 miles. Given their very different mixes of employment in 2000—Raleigh with just 17 percent in manufacturing and Hickory over 40 percent—we would expect Raleigh to adjust better to the Shock of increased trade penetration. And as we saw in Chart 3 above, this was the case.
As Adam Ozimek has recently pointed out, the resiliency of highly educated cities and commuting zones likely isn’t a coincidence or a mere correlation. It’s much more likely that it is a causal relationship, and there are good reasons a more-educated city would be better able to adapt to heavy exposure to the China Shock. So if there are policy implications to economically homogenous, lower-educated cities being less resilient in the face of an economic shock, it is that education and economic diversification would help, not trade barriers.
But there are other success cases we can identify that did not have Raleigh and Austin’s favorable starting position. Even San Jose, despite benefitting from the booming Silicon Valley, was a mediocre performer in employment growth, even though it performed well in wage growth (note: the wage figures are adjusted using national price indices, even though costs may have increased faster there).
One such success case is in Jonesboro, Arkansas. Employment grew faster than the national average, and wage growth also compared favorably. While Jonesboro is home to a mid-sized research university (Arkansas State University), it didn’t have a very high proportion of its population with college degrees in 2000: just 14.6 percent, less than half of the proportion in places like San Jose and Austin. Nonetheless, despite a 13 percent drop in goods-producing jobs in Jonesboro from 2000 to 2024, service-producing jobs grew by 55 percent. And this is not merely a “small base” effect, as service-sector employment was almost three times as large as goods-producing employment in 2000 in Jonesboro.
Jonesboro is no exception. Service sector employment grew in all 10 of these MSAs from 2000 to 2024, by as much as 116 percent in Austin, down to 14 and 15 percent in Lynchburg and Fort Wayne.
These outcomes reveal an important fact: contrary to the conventional political wisdom, most service-sector jobs are not bad, low-paying jobs. According to the latest BLS wage data, private-sector service jobs pay on average about $36 per hour, slightly higher than manufacturing at about $35 per hour. These are not large differences. But it is simply not the case that, on average, manufacturing jobs are better paying. And, in fact, many manufacturing jobs pay well below the wages in comparable blue-collar service industries.
Thus, once again, the lesson of the China Shock isn’t that we need more tariffs and industrial subsidies. Instead, it’s that the way to help Americans and US regions that are hurt by foreign trade (or any other economic shock) is to allow them to transition to a different, more modern industrial structure and allow their service sectors to flourish. As Lincicome and others have shown, numerous government policies thwart this necessary adjustment and thus make our workers and localities less resilient to shocks. Reforming these policies—not protectionism—should be the priority. Recovery from a large trade shock takes time, as David Autor and other economists explained recently, but that doesn’t mean recovery doesn’t happen.
To emphasize one more time, in this post I have focused on the MSAs that were most affected by the China Shock—in other words, the worst-case scenarios. Yet even these worst cases show that the US economy is more than able to adapt to employment changes brought on by international trade, even as we enjoy all of its other benefits.